Tuesday, August 24, 2021

Defining Safe Level 2 & Level 3 Vehicles

Hands on steering wheel

SAE J3016 defines vehicle automation levels, but is not a safety standard (nor does it claim to be). Levels 2 & 3 are especially problematic from a safety point of view. What they define if the standard is followed -- and no more -- is unlikely to provide acceptable safety in practice.

To be clear: a vehicle said to be SAE Level 2 or SAE Level 3 might be safe. But if it only does the bare minimum required for J3016 conformance, it is unlikely to be safe. More is needed.

(For more on the specifics of SAE J3016 Levels see this user guide (link) including a detailed discussion of what is and is not required by the SAE Levels.)

SAE Level 2 safety

SAE Level 2 requires that the driver be responsible for the Object and Event Detection and Response (OEDR). The driving automation might or might not see some objects, and might or might not respond properly, thus requiring continuous driver vigilance.

However, it is well known that human drivers do poorly at supervising automation. Paradoxically, the better the automation is, the worse they do. So something needs to be done to ensure that drivers are paying adequate attention to the driving, and avoid automation complacency. Driver monitoring is said to be "useful" in SAE J3016, but is completely optional.

This is a complex topic, but if you want to deploy a safe L2 system you need to address it with what I'll call "effective" driver monitoring (i.e., driver monitoring that makes sure you're paying enough attention). Maybe eye tracking and facial expression monitoring will be effective, but the jury is still out on real-world deployment at scale. We'll have to see. But specifying a particular technology won't solve the problem until we have that data. For now, we'll just say it has to be "effective" and that part needs to be worked out.

Finding 1: Safe SAE Level 2 vehicles need to meeting J3016 Level 2, plus the addition of effective driver monitoring.

SAE Level 3 safety

SAE Level 3 requires that the automated driving system (ADS) be able to completely handle the dynamic driving task (DDT), including both vehicle control and OEDR. (There is a common misconception that at Level 3 a driver is supposed to notice objects missed by the ADS. This is not true if the ADS is in a non-faulted state.)

SAE Level 3 puts the human driver in charge of fallback operations. If there is some sort of software or equipment failure the driver needs to bring the vehicle to a minimal risk condition (MRC), such as pulling over to a safe place at the side of the road. The ADS might help, but is not required to do so.

A crucial nuance in L3 is that the ADS is not required to notify the driver of all possible faults, and is not required to control the vehicle for long enough for the human driver to be able to resume control. For an ADS failure the requirement is only to give a "few" seconds warning. (For the ALKS standard it is 10 seconds, but it is clear that this is not going to be long enough for complex situations at higher speeds. Note that the current ALKS version is for low speed traffic jam operation, which might be a bit different than the more general case.) Moreover, in the event of an "evident" vehicle failure, there might be no warning at all from the ADS, and no grace period to regain control.

Telling human fallback drivers on the one hand that the vehicle drives itself, but on the other hand there are some failures that they need to react instantly to is a recipe for tragic loss events. One issue is that what is an "evident" failure to an automotive engineer might be meaningless to a civilian driver. (Have you ever seen a car driving with an obvious issue, such as billowing smoke pouring out the back from an engine burning itself up, a tire so low on air it is pulling the car to one side, or even a completely flat tire -- but the driver is oblivious?  I have.)  A driver who has been told not to pay attention might well be so engrossed in a video game, movie, or other distraction that "evident" failures go ignored.

Additionally, even if a human driver does feel the thump from a wheel falling off, consider that happening in high speed rush hour traffic. How long until the driver can grab the steering wheel, regain situational awareness, and react without hitting anything? Almost certainly longer than it takes to hit the first surrounding vehicle.  To be sure J3016 does not prevent the ADS from trying to do better, but it does not require it. That means that a vehicle that says "SAE Level 3" on the nameplate, but does no more than that, is problematic from a safety point of view.

There are three ways to go with this. One is to make sure that the driver is paying attention well enough to react to vehicle failures, just as with Level 2. Except now the vehicle is even more capable and the driver has even less to do. So driver monitoring is even more problematic.

Finding 2: Safe SAE Level 3 might be achieved by a vehicle meeting J3016 Level 3, plus the addition of driver monitoring that is effective even when the driver is assigned no role in the DDT.

(This strategy could be made easier if the ADS always warns the driver of any possible failure rather than not alarming for vehicle failures beyond the scope of ADS failures. Call this Finding 2a if you like, but it ends up in the same place of designing the system so the driver can handle the assigned fallback role reliably.)

Another strategy is to run in an operational design domain (ODD) so constrained that an in-lane stop is likely to be safe enough if it doesn't happen too often, and then require the vehicle to always be capable of doing an in-lane stop. By splitting wording hairs you can align this with L3 by designating the MRC as pull to side of road if it can, and if it can't execute an in-lane stop while calling that a "failure mitigation strategy" rather than an MRC maneuver. (See SAE J3016:2021 Figure 14.) This seems to be the strategy taken for ALKS, with the implicit rational that an in-lane stop might be safe enough in a traffic jam due to low speed of other vehicles in the jam.

In-lane stops still do not deal with the issue of vehicle failures not detected by the ADS or catastrophic ADS failures. So to be safe the vehicle would additionally need to be sure to do something (MRC or in-lane stop) in response to all vehicle failures relevant to safe driving, even if the driver has fallen asleep. Even if you're in a slow traffic jam, hitting a leading car at up to 60 kph because the driver failed to take over within a set 10 second time limit is still not a good idea for safety.

Finding 3: Safe SAE Level 3 might be achieved by a vehicle meeting J3016 Level 3, plus a requirement that a failure mitigation strategy always results in an in-lane stop if an MRC cannot be achieved, plus an ODD limitation that makes in-lane stops acceptably safe, plus a requirement that all DDT-relevant vehicle failures are automatically detected and trigger at least a failure mitigation strategy.

Finding 3 sounds complicated, but that is more or less where ALKS seems to be trying to end up.

But, what if you can guarantee that the Level 3 ADS will always bring you to an MRC no matter what goes wrong? You'd like the driver to take over, but if the driver doesn't take over the vehicle still does the Right Thing. That sounds great. But it also is -- by definition -- a Level 4 capable system. (See generally Myth #15 and Myth #16 here.)

Finding 4: Or, you could just build an SAE Level 4 system.

This points out a different aspect of the J3016 levels. An SAE Level 4 capable system might pull itself to the side of the road every kilometer and expect a driver to be ready to resume operation to get back on the road and up to driving speed before Level 4 operation can be activated again. (Being in the breakdown lane waiting for a driver to wake up from a nap is not necessarily all that safe -- ask emergency responders.) Or it might be a robotaxi that never, ever has a failure as long as it stays inside its geofence. Dramatically different, but both might still be legitimate Level 4 capable systems.

A different approach

For a different take on the safety-relevant requirements for vehicle automation, see my work on Vehicle Automation Modes. This is a view from a different perspective that is compatible with the SAE Levels, but emphasizes more what it takes to make a driver-friendly automated vehicle.
      

SAE J3016 User Guide

The SAE J3016:2021 standard (https://www.sae.org/standards/content/j3016_202104/) defines terminology for automated vehicles including the famous SAE Automation Levels. It is widely referenced in discussions, other standards, and even government regulations. Unfortunately, what is said about J3016 is too often inaccurate, misleading, or just plain incorrect.

Misinterpreting the SAE Levels can lead to misunderstandings about what the standard actually says, the technology incorporated into a car, and a driver's expectations. It's important to get statements in standards and regulations right. Moreover, it's important when referring to J3016 to understand that it says what it says, not what some author might want it to say, what might seem optimal for safety, or what other documents state that it says. (While this might seem obvious, perpetuation of misunderstandings is rampant.)

You can read the full user guide that explains the standard, its implications and debunks myths here:

 https://users.ece.cmu.edu/~koopman/j3016/


Wednesday, July 21, 2021

SAE J3016 Terminology and User Guide

 SAE J3016 Automation Levels are widely used, controversial -- and arguably not the right way to describe automation for anyone other than the engineers designing the systems.

In the video below I give a summary of SAE J3016 terminology and the infamous Levels and provide an alternative description approach. I also cover some of the many myths that so many people think are true, but which are not actually part of that standard at all.

I have also published a pretty thorough SAE J3016 User Guide that details more precise definitions and myths to help those who need to get things exactly right find the subtleties in the standard that are not apparent after only one (or two, or three) reads.

User guide:  https://users.ece.cmu.edu/~koopman/j3016/

Terminology video:

Sunday, June 20, 2021

A More Precise Definition for ANSI/UL 4600 Safety Performance Indicators (SPIs)

Safety Performance Indicators (SPIs) are defined by chapter 16 of ANSI/UL 4600 in the context of autonomous vehicles as performance metrics that are specifically related to safety (4600 at 16.1.1.6.1).

Woman in Taxi looking at phone.  Photo by Uriel Mont from Pexels

This is a fairly general definition that is intended to encompass both leading metrics (e.g., number of failed detections of pedestrians for a single sensor channel) and lagging metrics (e.g., number of collisions in real world operation).  

However, it is so general that there can be a tendency to try to call metrics that are not related to safety SPIs when, more properly, they are really KPIs. As an example, ride quality smoothness when cornering is a Key Performance Indicator (KPI) that is highly desirable for passenger comfort. But it might have little or nothing to do with the crash rate for a particular vehicle. (It might be correlated -- sloppy control might be associated with crashes, but it might not be.)

So we've come up with a more precise definition of SPI (with special thanks to Dr. Aaron Kane for long discussions and crystalizing the concept).

An SPI is a metric supported by evidence that uses a
threshold comparison to condition a claim in a safety case.

Let's break that down:

  • SPI - Safety Performance Indicator - a {metric, threshold} pair that measures some aspect of safety in an autonomous vehicle.
  • Metric - a value, typically related to one or more of product performance, design quality, process quality, or adherence to operational procedures. Often metrics are related to time (e.g., incidents per million km, maintenance mistakes per thousand repairs) but can also be related to particular versions (e.g., significant defects per thousand lines of code; unit test coverage; peer review effectiveness)
  • Evidence - the metric values are derived from measurement rather than theoretical calculations or other non-measurement sources
  • Threshold - a metric on its own is not an SPI because context within the safety case matters. For example, false negative detections on a sensor as a number is not a SPI because it misses the part about how good it has to be to provide acceptable safety when fused with other sensor data in a particular vehicle's operational context. ("We have 1% false negatives on camera #1. Is that good enough? Well, it depends...") There is no limit to the complexity of the threshold which might be, for example, whether a very complicated state space is either inside or outside a safety envelope.  But in the end the answer is some sort of comparison between the metric and the threshold that results in "true" or "false."  (Analogous multi-valued operations and outputs are OK if you are using multi-valued logic in your safety case.) We call the state of an SPI output being "false" an SPI Violation.
  • Condition a claim - each SPI is associated with a claim in a safety case. If the SPI is true the claim is supported by the SPI. If the SPI is false then the associated claim has been falsified. (SPIs based on time series data could be true for a long time before going false, so this is a time and state dependent outcome in many cases.)
  • Safety case - Per ANSI/UL 4600 a safety case is "a structured argument, supported by a body of evidence, that provides a compelling, comprehensible and valid case that a system is safe for a given application in a given environment." In the context of that standard, anything that is related to safety is in the safety case. If it's not in the safety case, it is by definition not related to safety.
A direct conclusion of the above is that if a metric does not have a threshold, or does not condition a claim in a safety case, then it can't be an SPI.

Less formally, the point of an SPI is that you've built up a safety case, but there is always the chance you missed something in the safety case argument (forgot a relevant reason why a claim might not be true), or made an assumption that isn't as true as you thought it was in the real world, or otherwise have some sort of a problem with your safety case. An SPI violation amounts to: "Well, you thought you had everything covered and this thing (claim) was always true. And yet, here we are with the claim being false when we encountered a particular unforeseen situation in validation or real world operation. Better update your safety argument!"

In other words, a SPI is a measurement you take to make sure that if your safety case is invalidated you'll detect it and notice that your safety case has a problem so that you can fix it.

An important point of all this is that not every metric is an SPI. SPIs are a very specific term. The rest are all KPIs.  

KPIs can be very useful, for example in measuring progress toward a functional system. But they are not SPIs unless they meet the definition given above.

NOTES:

The ideas in this posting are due in large part to efforts of Dr. Aaron Kane. He should be cited as a co-author of this work.

(1) Aviation uses SPI for metrics related to the operational phase and SMS activities. The definition given here is rooted in ANSI/UL 4600 and is a superset of the aviation use, including technical metrics and design cycle metrics as well as operational metrics.

(2) In this formulation an SPI is not quite the same as a safety monitor. It might well be that some SPI violations also happen to trigger a vehicle system shutdown. But for many SPI violations there might not be anything actionable at the individual vehicle level. Indeed, some SPI violations might only be detectable at the fleet level in retrospect. For example, if you have a budget of 1 incident per 100 million km of a particular type, an individual vehicle having such an incident does not necessarily mean the safety case has been invalidated. Rather, you need to look across the fleet data history to see if such an incident just happens to be that budgeted one in 100 million based on operational exposure, or is part of a trend of too many such incidents.

(3) We pronounce "SPI" as "S-P-I" rather than "spy" after a very confusing conversation in which we realized we needed to explain to a government official that we were not actually proposing that the CIA become involved with validating autonomous vehicle safety.


Thursday, June 17, 2021

Software Safety for Vehicle Automation Short Course

This is a short course lecture series that runs about 5 hours total. 


 YouTube pointers:

For those who don't have access to YouTube, an alternate source for these videos is archive.org:

L101 / L102 / L103 / L104 / L105 / L106 / L107 / L108 / L109 / L120

See also my other free on-line lectures here:  


Saturday, May 15, 2021

Proposal for putting the "Safety" back in the "S" of NHTSA

Summary: Overview of my comments on how NHTSA can effectively engage with the Automated Vehicle industry to ensure safety without inhibiting responsible innovation.

The National Highway Traffic Safety Administration is tasked with regulating non-commercial vehicle safety in the US.  Thus far, their approach to highly automated vehicles has been conspicuously hands-off with regard to safety, with more emphasis on not inhibiting innovation rather than ensuring that the innovation proceeds with reasonable safety. In late 2020 NHTSA put out an ANPRM (Advanced Notice of Proposed Rule Making) proposing an approach to changing this situation.  This approach is significantly based on adopting existing industry standards.  Here is my high level response.  (Link at the end of this to full document.)

Sunday, April 4, 2021

A Driver-Centric User’s Guide to Vehicle Automation Modes

Vehicle Automation Modes emphasize the responsibilities of a self-driving vehicle user

By: Dr. Philip Koopman, Carnegie Mellon University

Image CC BY 4.0 https://creativecommons.org/licenses/by/4.0/

(See the accompanying video here:  YouTube | Archive.org)

If you follow self-driving car technology it’s likely you’ve encountered the SAE Levels of automation. The SAE Levels range from 0 to 5, with higher numbers indicating more capable driving automation technology. Unfortunately, in public discussions there is significant confusion and misuse of that terminology. In large part that is because the SAE Levels are primarily based on an engineering view rather than the perspective of a person driving the car.

We need a different categorization approach. One that emphasizes how drivers and organizations will deploy these vehicles rather than the underlying technology. This is not a replacement for the engineering use of SAE levels, but rather a complementary tool for public discussions of the technology that emphasizes the practical aspects of the driver’s role in vehicle operation.

If you doubt that another set of terminology is needed, consider the common informal use of the term “Level 2+,” which is undefined by the underlying SAE J3016 standard that sets the SAE Levels. Consider also the fact that different companies mean significantly different things when they say “Level 3.” In some cases Level 3 follows SAE J3016, meaning that the driver is responsible for monitoring vehicle operation and being ready to jump in — even without any notice at all — to take over if something goes wrong. In other cases vehicles described as Level 3 are expected to safely bring themselves to a stop even if the driver does not notice a problem, which is more like a “Level 3+” concept (also undefined by SAE J3016).

Other Safety

Even more importantly, the SAE Levels say nothing about all the safety relevant tasks that a human driver does beyond actual driving. For example, someone has to make sure that the kids are buckled into their car seats. To actually deploy such vehicles, we need to cover the whole picture, in which driving is critical but only a piece of the safety puzzle.

The Five Operational Modes

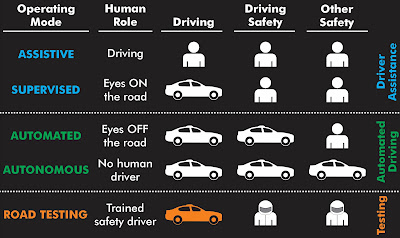
In creating a driver-centric description of capabilities, the most important thing is not the details of the technology, but rather what role and responsibility the driver is assigned in overall vehicle operation. We propose five categories of vehicle operation: Assistive, Supervised, Automated, and Autonomous.

Woman driving with both hands on the wheel.

Assistive: A licensed human driver drives, and the vehicle assists.
  • Human Role: Driving
  • Driving: Human
  • Driving Safety: Human
  • Other Safety: Human
The technology’s job is to help the driver do better by improving the vehicle’s ability to execute the driver’s commands and reduce the severity of any impending crash.

This might include anti-lock brakes, stability control, cruise control, and automatic emergency braking. The driver always remains in the loop, exerting at least some form of continuous control over speed, lane keeping, or both. Most passenger vehicles on the road today are Assistive. Generally, this maps to SAE Level 1 and some portions of SAE Level 2.


Woman hands off the steering wheel. Eyes on the road monitoring the vehicle

Supervised: The vehicle drives, but a human driver is responsible for ensuring safety.
  • Human Role: Eyes ON Road
  • Driving: Vehicle
  • Driving Safety: Human
  • Other Safety: Human
Technology normally handles all aspects of the driving task. However, a licensed human driver is responsible for continuous monitoring of driving safety and taking over control instantly if something goes wrong. The driver is not expected to perform a continuous control function such as steering or speed control while in this operating mode. An effective driver monitoring system is required to ensure driver ability to take over when required. 

Tesla “Autopilot” and GM Super Cruise are examples of Supervised operating modes. Generally, this maps to SAE Levels 2 and 3. Achieving safety will depend on getting sufficient driver engagement and avoiding having the vehicle put the driver into an untenable recovery situation.

Supervised autonomy should make it reasonable to expect a civilian driver without specialized training to maintain safety. As a practical matter, this limits use to highway cruise-control style applications where the vehicle does both lane keeping and speed/separation control. If the vehicle can make turns at intersections, it is beyond what is reasonably safe for civilian driver supervision, and instead is likely to be a road test vehicle.


Man reading with eyes off the road as vehicle performs driving tasks

Automated:
The vehicle performs the complete driving task.
  • Human Role: Eyes OFF Road
  • Driving: Vehicle
  • Driving Safety: Vehicle
  • Other Safety: Human
A human driver is not required to operate the vehicle in this mode. However, a responsible person is required to ensure other aspects of vehicle safety such as buckling up the kids, proper securing of any cargo, and post-crash response. Simply put, in this operation mode the vehicle does the driving, but a responsible human is still the “captain of the ship” for handling everything except the driving. In some cases, there might be an expectation that a human driver moves the vehicle under manual control during portions of a trip that are not suitable for Automated operation. 

Examples of Automated operation include a heavy truck on divided highway portions of its route, and low speed shuttles that require human conductors for passenger safety. Generally this maps to SAE Levels 4 and 5. Achieving safety will depend on the automated driver being able to handle everything that might occur during driving, and ensuring the vehicle takes safe actions even with no driver intervention when its driving capabilities have been exceeded.


No human behind the wheel.

Autonomous: The whole vehicle is completely capable of operation with no human monitoring.
  • Human Role: No Human Driver
  • Driving: Vehicle
  • Driving Safety: Vehicle
  • Other Safety: Vehicle
The vehicle can complete an entire driving mission under normal circumstances without human supervision. If something goes wrong, the vehicle is entirely responsible for alerting humans that it needs assistance, and for operating safely until that assistance is available. Things that might go wrong include not only encountering unforeseen situations and technology failures, but also flat tires, a battery fire, being hit by another vehicle, or all of these things at once. People in the vehicle, if there are any, might not be licensed drivers, and might not be capable of assuming the role of “captain of the ship.” 

Examples of Autonomous vehicles might include uncrewed robo-taxis, driverless last mile delivery vehicles, and heavy trucks in which the driver is permitted to be asleep. Achieving safety will depend on the autonomous vehicle being able to handle everything that comes its way, for example according to the UL 4600 safety standard. Generally this maps to SAE Levels 4 and 5 in addition to handling vehicle safety issues beyond the scope of SAE J3016.


Photo by Alena Darmel from Pexels

Road Testing: A trained safety driver supervises the operation of an automation testing platform.
  • Human Role: Trained safety driver
  • Driving: Vehicle
  • Driving Safety: Human
  • Other Safety: Human
The vehicle is a test bed for vehicle automation features. Because it is immature technology, the driver must have specialized training and operating procedures to ensure public safety, for example according to the SAE J3018 road testing operator safety standard.

Driver Roles:

No simple set of descriptive terms like this can be perfect, and this approach will inevitably have its shades of gray. However, it has the distinct advantage that human drivers will have clear expectations of their roles:
  • Assistive: Human drives.
  • Supervised: Human monitors and takes over if needed.
  • Automated: Human can ignore driving, but ensures other aspects of vehicle safety.
  • Autonomous: No human involvement needed to ensure safety.
  • Road testing: Specially trained safety operator monitors and compensates for potential design defects

Driver Liability:

Another related advantage is that it provides a more straightforward way to describe potential human driver liability:
  • Assistive: As with conventional human driving.
  • Supervised: The human driver is responsible for safety unless the vehicle does something dangerous that is beyond a reasonable human driver capacity to intervene.
  • Automated: The human driver is not responsible for driving errors, but is responsible for non-driving aspects of safety such as passenger safety, proper cargo loading, and post-crash situation management.
  • Autonomous: There is no human driver to blame for mistakes.
  • Road testing: The testing organization is responsible for safety in accordance with an SMS (Safety Management System). This requires special safety driver selection, training, monitoring, and testing procedures.

Multiple Operational Modes:

A single vehicle can employ various operational modes across its Operational Design Domain (ODD). What is most important is that at any particular time the vehicle and the driver both understand that the vehicle is in exactly one of the five operational modes so that the driver’s responsibilities remain clear. As a simplified example, the same car might operate as Autonomous in a specially equipped parking garage, Automated on limited access highways, Supervised on designated main roads, and Assistive at other times. In such a car it would be important to ensure that the human driver is aware of and capable of performing accompanying driver responsibilities when modes change.

We think it would benefit consumers and other stakeholders if discussions regarding vehicle automation capabilities encompassed a driver's point of view using the terms: Assistive, Supervised, Automated, Autonomous, and road testing. That could help reduce confusion and even reduce the loss of life caused by misunderstanding the responsibilities of the driver in different operational modes.

But what about the SAE Levels?

The point is to not use the SAE Levels when messaging to consumers, legislators, and non-engineers. But for those who really want to see it, here's the way things line up:


If you find it surprising that SAE J3016 Level 3 is Supervised instead of Automated, read this:  https://users.ece.cmu.edu/~koopman/j3016/#myth07

If you find it surprising that Autonomous mode is beyond Level 5, read this: https://users.ece.cmu.edu/~koopman/j3016/#myth11

If you find it surprising that road testing does not appear on that chart, that's because SAE J3016 classifies by intent rather than capability, and does not have a separate category for road testing.

Get the Mug & T-Shirt!

You can get a mug, t-shirt, and other swag here:
(Sold at zero mark-up; distribution area limited.)

If you want to make your own poster, t-shirt, mug, or whatever, feel free to download the high resolution graphic and do it yourself.  No permission required!  (Hint: you can often get a better discount price at CafePress by uploading one of the below graphics and using a coupon code rather than using the store above. Go for it!  The store is just for convenience.)


Updated 12/13/2021

Sunday, December 13, 2020

Safety Performance Indicator (SPI) metrics (Metrics Episode 14)

SPIs help ensure that assumptions in the safety case are valid, that risks are being mitigated as effectively as you thought they would be, and that fault and failure responses are actually working the way you thought they would.

Safety Performance Indicators, or SPIs, are safety metrics defined in the Underwriters Laboratories 4600 standard. The 4600 SPI approach covers a number of different ways to approach safety metrics for a self-driving car, divided into several categories.

One type of 4600 SPI safety metric is a system-level safety metric. Some of these are lagging metrics such as the number of collisions, injuries and fatalities. But others have some leading metric characteristics because while they’re taken during deployment, they’re intended to predict loss events. Examples of these are incidents for which no loss occurs, sometimes called near misses or near hits, and the number of traffic rule violations. While by definition, neither of these actually results in a loss, it’s a pretty good bet that if you have many, many near misses and many traffic-rule infractions, eventually something worse will happen.

Another type of 4600 metric is intended to deal with ineffective risk mitigation. An important type of SPI relates to measuring that hazards and faults are not occurring more frequently than expected in the field.

Here’s a narrow but concrete example. Let’s assume your design takes into account that you might lose one in a million network packets due to corrupted data being detected. But out in the field, you’re dropping every tenth network packet. Something’s clearly wrong, and it’s a pretty good chance that undetected errors are slipping through. You need to do something about that situation to maintain safety.

A broader example is that a very rare hazard might be deemed not to be risky because it just essentially never happens. But just because you think it almost never happens doesn’t mean that’s what happens in the real world. You need to take data to make sure that something you thought would happen to one vehicle in the fleet every hundred years isn’t in fact happening every day to someone, because if that’s the case, you badly misestimated your risk.

Another type of SPI for field data is measuring how often components fail or behave badly. For example, you might have two redundant computers so that if one crashes, the other one will keep working. Consider one of those computers is failing every 10 minutes. You might drive around for an entire day and not really notice there’s a problem because there’s always a second computer there for you. But if your calculations assume a failure once a year and it’s failing every 10 minutes, you’re going to get unlucky and have both fail at the same time a lot sooner than you expected. 

So it’s important to know that you have an underlying problem, even though it’s being masked by the fault tolerance strategy.

A related type of SPI has to do with classification algorithm performance for self-driving cars. When you’re doing your safety analysis, it’s likely you’re assuming certain false positive and false negative rates for your perception system. But just because you see those in testing doesn’t mean you’ll see those in the real world, especially if the operational design domain changes and new things pop up that you didn’t train on. So you need a SPI to monitor the false negative and false positive rates to make sure that they don’t change from what you expected.

Now, you might be asking, how do you figure out false negatives if you didn’t see it? But in fact, there’s a way to approach this problem with automatic detection. Let’s say that you have three different types of sensors for redundancy and you vote three sensors and go with the majority. Well, that means every once in a while, one of the sensors can be wrong and you still get safe behavior. But what you want to do is take a measurement of how often the one wrong happens, because if it happens frequently, or the faults on that sensor correlate with certain types of objects, those are important things to know to make sure your safety case is still valid.

A third type of 4600 metric is intended to measure how often surprises are encountered. There’s another segment on surprises, but examples are the frequency at which an object is classified with poor confidence, or a safety relevant object flickers between classifications. These give you a hint that something is wrong with your perception system, and that it’s struggling with some type of object. If this happens constantly, then that indicates a problem with the perception system. It might indicate that the environment has changed and includes novel objects not accounted for by training data. Either way, monitoring for excessive perception issues is important to know that your perception performance is degraded, even if an underlying tracking system or other mechanism is keeping your system safe.

A fourth type of 4600 metric is related to recoveries from faults and failures. It is common to argue that safety-critical systems are in fact safe because they use fail-safes and fall-back operational modes. So if something bad happens, you argue that the system will do something safe. It’s good to have metrics that measure how often those mechanisms are in fact invoked, because if they’re invoked more often than you expected, you might be taking more risks than you thought. It’s also important to measure how often they actually work. Nothing’s going to be perfect. And if you’re assuming they work 99% of the time but they only work 90% of the time, that dramatically changes your safety calculations.

It’s useful to differentiate between two related concepts. One is safety performance indicators, SPIs, which is what I’ve been talking about. But another concept is key performance indicators, KPIs. KPIs are used in project management and are very useful to try and measure product performance and utility provided to the customer. KPIs are a great way of tracking whether you’re making progress on the intended functionality and the general product quality, but not every KPI is useful for safety. For example, a KPI for a fuel economy is great stuff, but normally it doesn’t have that much to do with safety.

In contrast, an SPI is supposed to be something that’s directly traced to parts of the safety case and provides evidence for the safety case. Different types of SPIs include making sure the assumptions in the safety case are valid, that risks are being mitigated as effectively as you thought they would be, and that fault and failure responses are actually working the way you thought they would. Overall, SPIs have more to do with whether the safety case is valid and the rate of unknown surprise arrivals is tolerable. All these areas need to be addressed one way or another to deploy a safe self-driving car.

Saturday, December 12, 2020

Conformance Metrics (Metrics Episode 13)

Metrics that evaluate progress in conforming to an appropriate safety standard can help track safety during development. Beware of weak conformance claims such as only hardware, but not software, conforms to a safety standard.

Conformance metrics have to do with how extensively your system conforms to a safety standard. 

A typical software or systems safety standard has a large number of requirements to meet the standard, with each requirement often called clauses. An example of a clause might be something like "all hazards shall be identified" and another clause might be "all identified hazard shall be mitigated."  (Strictly speaking a clause is typically a numbered statement in the standard in the form of a "shall" requirement that usually has a lot more words in it than those simplified examples.)

There are often extensive tables of engineering techniques or technical mitigation measures that need to be done based on the risk presented by each hazard. For example, mitigating a low risk hazard might just need normal software quality practices, while a life critical hazard might need dozens or hundreds of very specific safety and software quality techniques to make sure the software is not going to fail in use. The higher the risk, the more table entries need to be performed in design validation and deployment.

The simplest metric related to a safety standard is as simple yes/no question: Do you actually conform to the standard? 

However, there are nuances that matter. Conforming to a standard might mean a lot less than you might think for a number of reasons. So one way to measure the value of that conformance statement is to ask about the scope of the conformance and any assessment that was performed to confirm the conformance. For example, is a conformance just hardware components and not software also, or is it both hardware and software? It’s fairly common to see claims of conformance to an appropriate safety standard that only covered the hardware, and that’s a problem if a lot of the safety critical functionality is actually in the software.

If it does cover the software, what scope? Is it just the self test software that exercises the hardware (again, a common conformance claim that omits important aspects of the product)? Does it include the operating system? Does it include all the application software that’s relevant to safety? What actually is the claim of conformance be made on? Is it just a single component within a very large system? Is it a subsystem? Is it entire vehicle? Does it cover both the vehicle and its cloud infrastructure and the communications to the cloud? Does it cover the system used to collect training data that is assumed to be accurate to create a safety critical machine learning based system? And so on. So if you see a claim of conformance, be sure to ask what exactly the claim applies to you because it might not be everything that matters for safety.

Also conformance can have different levels of credibility ranging from – well it’s "in the spirit of the standard."  Or "we use an internal standard that we think is equivalent to this international standard." Or "our engineering team decided we think we meet it." Or "a team inside our company thinks we meet it but they report to the engineering manager so there’s pressure upon them to say yes." Or "conformance evaluation is done by a robustly separated group inside our company." Or "conformance evaluation is done via qualified external assessment with a solid track record for technical integrity." 

Depending on the system, any one of these categories might be appropriate. But for life critical systems, you need as much independence and actual standards conformance as you can get. If you hear a claim for conformance it’s reasonable ask: well, how do you know you conform to the extent that matters, and is the group assessing conformance independent enough and credible enough for this particular application?

Another dimension of conformance metrics is: how much of the standard is actually being conformed to? Is it only some chapters or all of the chapters? Sometimes we’re back to where only the hardware conformed so they really only looked at one chapter of a system standard that would otherwise cover hardware and software. Is it only the minimum basics? Some standards have a significant amount of  text that some treat as optional (in the lingo: "non-normative clauses"). In some standards most of the test is not actually required to claim conformance. So did only the required texts get addressed or were the optional parts addressed as well?

Is the integrity level appropriate? So it might conform to a lower ASIL than you really need for your application, but it still has the conformance stamp to the standard on it. That can be a problem if using, for example, something assessed for noncritical functions and you want to use it in a life critical application. Is the scope of the claim conformance appropriate? For example, you might have dozens of safety critical functions in a system, but only three or four were actually checked for conformance and the rest were not. You can say it conforms to a standard, but the problem is there’s pieces that really matter that were never checked for conformance.

Has the standard been aggressively tailored so that it weakens the value of the claim conformance? Some standards, permit skipping some clauses if they don’t matter to safety in that particular application, but with funding and deadline pressures, there might be some incentive to drop out clauses that really might matter. So it’s important to understand how tailored the standard was. Was that the full standard or where pieces left out that really should matter?

Now to be sure, sometimes limited conformance on all these paths makes perfect sense. It’s okay to do that so long as, first of all, you don’t compromise safety. So you’re only leaving out things that don’t matter to safety. Second you’re crystal clear about what you’re claiming and you don’t ask more of the system that can really deliver for safety. 

Typically signs of aggressive tailoring or conformance to only part of a standard are problematic for life critical systems. It’s common to see misunderstandings based on one or more of these issues. Somebody claims conformance to a standard does not disclose the limitations and somebody else gets confused and says, oh, well, the safety box has been checked so nothing to worry about. But, in fact safety is a problem because the conformance claim is much narrower than is required for safety in that application.

During development (before the design is complete), partial conformance and measuring progress against partial conformance can actually be quite helpful. Ideally, there’s a safety case that documents the conformance plan and has a list of how you plan to conform to all the aspects of the standard you care about. Then you can measure progress against the completeness of the safety case. The progress is probably not linear, and not every clause take same amount of effort.  But still just looking at what fraction of the standard you’ve achieved conformance to internally can be very helpful for managing the engineering process.

Near the end of the design validation process, you can do mock conformance checks. The metric there is the number of problems found with conformance, which basically amounts to bug reports against the safety case rather than against the software itself.

Summing up, conforming to relevant safety standards is an essential part of ensuring safety, especially in life critical products. There are a number of metrics, measures and ways to assess how well that conformance actually is going to help your safety. It’s important to make sure you’ve conformed to the right standards, you’ve conformed with the right scope and that you’ve done the right amount of tailoring so that you’re actually hitting all the things that you need to in the engineering validation and deployment process to ensure you’re appropriately safe.

Surprise Metrics (Metrics Episode 12)

You can estimate how many unknown unknowns are left to deal with via a metric that measures the surprise arrival rate.  Assuming you're really looking, infrequent surprises predict that they will be infrequent in the near future as well.

Your first reaction to thinking about measuring unknown unknowns may be how in the world can you do that? Well, it turns out the software engineering community has been doing this for decades: they call it software reliability growth modeling. That area’s quite complex with a lot of history, but for our purposes, I’ll boil it down to the basics.

Software reliability growth modeling deals with the problem of knowing whether your software is reliable enough, or in other words, whether or not you’ve taken out enough bugs that it’s time to ship the software. All things being equal, if a complete same system test reveals 10 times more defects in the current release than in the previous release, it’s a good bet your new release is not as reliable as your old one.

On the other hand, if you’re running a weekly test/debug cycle with a single release, so every week you test it, you remove some bugs, then you test it some more the next week, at some point you’d hope that the number of bugs found each week will be lower, and eventually you’ll stop finding bugs. When the number of bugs per week you find is low enough, maybe zero, or maybe some small number, you decide it’s time to ship. Now that doesn’t mean your software is perfect! But what it does mean is there’s no point testing anymore if you’re consistently not finding bugs. Alternately, if you have a limited testing budget, you can look at the curve over time of the number of bugs you’re discovering each week and get some sort of estimate about how many bugs you would find if you continued testing for additional cycles.

At some point, you may decide that the number of bugs you’ll find and the amount of time it will take simply isn’t worth the expense. And especially for a system that is not life critical, you may decide it’s just time to ship. A dizzying array of mathematical models has been proposed over the years for the shape of the curve of how many more bugs are left in the system based on your historical rate of how often you find bugs. Each one of those models comes with significant assumptions and limits to applicability. 

But the point is that people have been thinking about this for more than 40 years in terms of how to project how many more bugs are left in a system even though you haven’t found them. And there’s no point trying to reinvent all those approaches yourself.

Okay, so what does this have to do with self-driving car metrics?

Well, it’s really the same problem. In software tests, the bugs are the unknowns, because if you knew where the bugs were, you’d fix them.  You’re trying to estimate how many unknowns there are or how often they’re going to arrive during a testing process. In self-driving cars, the unknown unknowns are the things you haven’t trained on or haven’t thought about in the design. You’re doing road testing, simulation and other types of validation to try and uncover these. But it ends up in the same place. You’re trying to look for latent defects or functionality gaps and you’re trying to get idea of how many more there are left in the system that you haven’t found yet, or how many you can expect to find if you invest more resources in further testing.

For simplicity, let’s call the things in self-driving cars that you haven’t found yet surprises. 

The reason I put it this way is that there are two fundamentally different types of defects in these systems. One is you built the system the wrong way. It’s an actual software bug. You knew what you were supposed to do, and you didn’t get there. Traditional software testing and traditional software quality will help with those, but a surprise isn’t that. 

A surprise is a requirements gap or something in the environment you didn’t know was there. Or a surprise has to do with imperfect knowledge of the external world. But you can still treat it as a similar, although different, class from software defects and go at it the same way. One way to look at this is a surprise is something you didn’t realize should be in your ODD and therefore is a defect in the ODD description. Or, you didn’t realize the surprise could kick your vehicle out of the ODD and is a defect in the model of ODD violations that you have to detect. You’d expect that surprises that can lead to safety-critical failures are the ones that need the highest priority for remediation.

To create a metric for surprises, you need to track the number of surprises over time. You hope that over time, the arrival rate of surprises gets lower. In other words, they happen less often and that reflects that your product has gotten more mature, all things being equal. 

If the number of surprises gets higher, that could be a sign that your system has gotten worse with dealing unknowns, or could also be a sign that your operational domain has changed, and more novel things are happening than used to because of some change in the outside world. That requires you to update your ODD to reflect the new real world situation. Either way, a higher rival rate of surprises means you’re less mature or less reliable and a lower rate means you’re probably doing better.

This may sound a little bit like disengagements as a metric, but there’s a profound difference. That difference applies even if disengagements on road testing are one of the sources of data.

The idea is that measuring how often you disengage, that a safety driver takes over, or the system gives up and says, “I don’t know what to do” is a source of raw data. But the disengagements could be for many different reasons. And what you really care about for surprises is only disengagements that happened because of a defect in the ODD description or some other requirements gap.

Each incident that could be a surprise needs to be analyzed to see if it was a design defect, which isn’t really an unknown unknown. That’s just a mistake that needs to be fixed.

But some incidents will be true unknown unknown situations that require re-engineering or retraining your perception system or another remediation to handle something you didn’t realize until now was a requirement or operational condition that you need to deal with. Since even with a perfect design and perfect implementation, unknowns are going to continue to present risk, what you need to be tracking with a surprise metric is the arrival of actual surprises.

It should be obvious that you need to be looking for surprises to see them. That’s why things like monitoring near misses and investigating the occurrence of unexpected, but seemingly benign, behavior matters. Safety culture plays a role here. You have to be paying attention to surprises instead of dismissing them if they didn’t seem to do immediate harm. A deployment decision can use the surprise arrival rate metric to get an approximate answer of how much risk will be taken due to things missing from the system requirements and test plan. In other words, if you’re seeing surprises arrive every few minutes or every hour and you deploy, there’s every reason to believe that will continue to happen about that often during your initial deployment.

If you haven’t seen a surprise in thousands or hundreds of thousands of hours of testing, then you can reasonably assume that surprises are unlikely to happen every hour once you deploy. (You can always get unlucky, so this is playing the odds to be sure.)

To deploy, you want to see the surprise arrival rate reduced to something acceptably low. You’ll also want to know the system has a good track record so that when a surprise does happen, it’s pretty good at recognizing something has gone wrong and doing something safe in response.

To be clear, in the real world, the arrival rate of surprises will probably never be zero, but you need to measure that it’s acceptably low so you can make a responsible deployment decision.

Operational Design Domain Metrics (Metrics Episode 11)

Operational Design Domain metrics (ODD metrics) deal with both how thoroughly the ODD has been validated as well as the completeness of the ODD description. How often the vehicle is forcibly ejected from its ODD also matters.

Operational Design Domain metrics (ODD metrics) deal with both how thoroughly the ODD has been validated as well as the completeness of the ODD description.

An ODD is the designer’s model of the types of things that the self-driving cars intended to deal with. The actual world, in general, is going to have things that are outside the ODD. As a simple example, the ODD might include fair weather and rain, but snow and ice might be outside the ODD because the vehicle is intended to be deployed in a place where snow is very infrequent.

Despite designer’s best efforts, it’s always possible for the ODD to be violated. For example, if the ODD is Las Vegas in the desert, this system might be designed for mostly dry weather or possibly light rain. But in fact, in Vegas, once in a while, it rains and sometimes it even snows. The day that it snows the vehicle will be outside its ODD, even though it’s deployed in Las Vegas.

There are several types of ODD safety metrics that can be helpful. One is how well validation covers the ODD. What that means is whether the testing, analysis, simulation and other validation actually cover everything in the ODD, or have gaps in coverage.

When considering ODD coverage it’s important to realize that ODDs have many, many dimensions. There are much more than just geo-fencing boundaries. Sure, there’s day and night, wet versus dry, and freeze versus thaw.  But you also have traffic rules, condition of road markings, the types of vehicles present, the types of pedestrians present, whether there are leaves on the tree that affect LIDAR localization, and so on.  All these things and more can affect perception, planning, and motion constraints.

While it’s true that a geo-fence area can help limit some of the diversity in the ODD, simply specifying a geo-fence doesn’t tell you everything you need to know, and you’ve covered all the things that are inside that geo-fenced area. Metrics for ODD validation can be based on a detailed model of what’s actually in the ODD -- basically an ODD taxonomy of all the different factors that have to be handled and how well testing, simulation, and other validation cover that taxonomy.

Another type of metric is how well the system detects ODD violations. At some point, a vehicle will be forcibly ejected from its ODD even though it didn’t do anything wrong, simply due to external events. For example, a freak snowstorm in the desert, a tornado or the appearance of a new type of completely unexpected vehicle and force a vehicle out of its ODD with essentially no warning. The system has to recognize when it has exited its ODD and be safe. A metric related to this is how often ODD violations are happening during testing and on the road after deployment.

Another metric is what fraction of ODD violations are actually detected by the vehicle. This could be a crucial safety metric, because if an ODD violation occurs and the vehicle doesn’t know it, it might be operating unsafely. Now it’s hard to build a detector for ODD violations that the vehicle can’t detect (and such failures should be corrected). But this metric can be gathered by root cause analysis whenever there’s been some sort of system failure or incident. One of the root causes might simply be failure to detect an ODD violation.

Coverage of the ODD is important, but an equally important question is how good is the ODD description itself? If your ODD description is missing many things that happen every day in your actual operational domain (the real world,), then you’re going to have some problems.

A higher level of metric to talk about is ODD description quality. That is likely to be tied to other metrics already mentioned in this and other segments. Here are some examples. The frequency of ODD violations can help inform the coverage metric of the ODD against the operational domain. Frequency of motion failures could be related to motion system problems, but could also be due to missing environmental characteristics in your ODD. For example, cobblestone pavers are going to have significantly different surface dynamics than a smooth concrete surface and might come as a surprise when they are encountered. 

Frequency of perception failures could be due to training issues, but could also be something missing from the ODD object taxonomy. For example, a new aggressive clothing style or new types of vehicles. The frequency of planning failures could be due to planning bugs, but could also be due to the ODD missing descriptions of informal local traffic conventions.

Frequency of prediction failures could be prediction issues, but could also be due to missing a specific class of actors. For example, groups of 10 and 20 runners in formation near a military base might present a challenge if formation runners aren't in training data. It might be okay to have an incomplete ODD so long as you can always tell when something is happening that forced you out of the ODD. But it’s important to consider that metric issues in various areas might be due to unintentionally restricted ODD versus being an actual failure of the system design itself.

Summing up, ODD metric should address how well validation covers the whole ODD and how well the system detects ODD violations. It’s also useful to consider that a cause of poor metrics and other aspects of the design might in fact be that the ODD description is missing something important compared to what happens in the real world.

Prediction Metrics (Metrics Episode 10)

You need to drive not where the free space is, but where the free space is going to be when you get there. That means perception classification errors can affect not only the "what" but also the "future where" of an object.

Prediction metrics deal with how well a self driving car is able to take the results of perception data and predict what happens next so that it can create a safe plan. 

There are different levels of prediction sophistication required depending on operational conditions and desired own-vehicle capability. The first, simplest prediction capability is no prediction at all. If you have a low speed vehicle in an operational design domain in which everything is guaranteed to also be moving at low speeds and be relatively far away compared to the speeds, then a fast enough control loop might be able to handle things based simply on current object positions. The assumption there would be everything’s moving slowly, it’s far away, and you can stop your vehicle faster than things can get out of control.  (Note that if you move slowly but other vehicles move quickly, that violates the assumptions for this case.)

The prediction basically amounts to, nothing moves fast compared to its distance. But even here, a prediction metric can be helpful because there’s an assumption that everything is moving slow compared to its distance away. That assumption might be violated by nearby objects moving slowly but a little bit too fast because they’re so close, or by far away things moving fast such as a high speed vehicle in an urban environment that is supposed to have a low speed limit. The frequency at which the assumption is violated that things move slowly compared to the distance away will be an important safety metric.

For self driving cars that operate at more than a slow crawl. You’ll start to need some sort of prediction based on likely object movement. You often hear: "drive to where the free space is" with the free space being the open road space that’s safe for a car to maneuver in. 

But that doesn’t actually work once you’re doing more than about walking speed, because it isn’t where the free space is now that matters. What you need to do is to drive to where the free space is going to be when you get there. Doing that requires prediction because many of the things on the road move over time, changing where the free space is one second from now, versus five seconds from now, versus 10 seconds from now.

A starting point for prediction is assuming that everything maintains the same speed and direction as it currently has and update the speeds and directions periodically as you run your control loop. Doing this requires tracking so that you know not only where something is, but also what its direction and speed are. That means that with this type of prediction, metrics having to do with tracking accuracy become important, including distance, direction of travel and speed. 

For safety it isn’t perfect position accuracy on an absolute coordinate frame that matters, but rather whether tracking is accurate enough to know if there’s a potential collision situation or other danger. It’s likely that better accuracy is required for things that are close and things that are moving quickly toward you and in general things that pose collision threats. 

For more sophisticated self driving cars, you’ll need to predict something more sophisticated than just tracking data. That’s because other vehicles, people, animals and so on will change direction or even change their mind about where they’re going or what they’re doing. 

From a physics point of view, one way to look at this is in terms of derivatives. The simplest prediction is the current position. A slightly more sophisticated prediction has to do with the first derivative: speed and direction. An even more sophisticated prediction would be to use the second derivative: acceleration and curvature. You can even use the third derivative: jerk or change in acceleration. To the degree you can predict these things, you’ll be able to have a better understanding of where the free space will be when you get there.

From an every day point of view, the way to look at it is that real things don’t stand still -- they move. But when they’re moving, they change direction, they change speed, and sometimes they completely change what they’re trying to do, maybe doubling back on themselves. 

An example of a critical scenario is a pedestrian standing on a curb waiting for a crossing light. Human drivers use the person’s body language to tell the pedestrian is a risk of stepping off the curb even though they’re not supposed to be crossing. While that’s not perfect, most drivers will have stories of the time they didn’t hit someone because they noticed the person was distracted by looking at their cell phone or the person looked like they were about to jump into the road and so on. If you only look at speed and possibly acceleration, you won’t handle cases in which a human driver would say, “That looks dangerous. I’m going to slow down to give myself more reaction time in case behavior changes suddenly.” 

It isn’t just the current trajectory that matters for a pedestrian. It’s what the pedestrian’s about to do, which might be a dramatic change from standing still to running across through to catch a bus. 

The same would hold true for a human driver of another vehicle that you have some telltale available that suggests they’re about to swerve or turn in front of you. For even more sophisticated predictions, you probably don’t end up with a single prediction, but rather with a probability cloud of possible positions and directions of travel over time, where keeping on the same path might be the most probable. But a maximum command authority, right turn left turn, accelerate, decelerate might all be possible with lower probability but not zero probability. Given how complicated prediction can be, metrics might have to be more complicated than simply "did you guess exactly right?"  There’s always going to be some margin of error in any prediction, but you need to predict in a way that results in acceptable safety even in the face of surprises.

One way to handle the prediction is to take a snapshot of the current position and the predicted movement. Wait a few control loop cycles, some fractions of a second or a second. Then check to see how it turned out. In other words, you can just wait a little while, see how well your prediction turned out and keep score as to how good your prediction is. In terms of metrics, you need some sort of bounds on the worst case error of prediction. Every time that bound is violated, it is potentially a safety-related event and should be counting it as a metric. Those bounds might be probabilistic in nature, but at some point there has to be a bound as to what is acceptable prediction error and what’s not.

To the degree that prediction is based on object type, for example, you’re likely to assume a pedestrian typically cannot go as fast as a bicycle, but that a pedestrian can jump backwards and pivot turn. You might want to know if the type-specific prediction behavior is violated. For example, a pedestrian suddenly going from stop to 20 miles per hour crossing right in front of your car, might be a competitive sprinter that’s decided to run across the road, but more likely signals that electric rental scooters have arrived in your town and you need to include them in your operational design domain.

Prediction metrics might be related to the metrics for correct object classification if the prediction is based on the class of the object. 

Summing up, sophisticated prediction of behavior might be needed for highly permissive operation in complex dense environments. If you’re in a narrow city street with pedestrians close by and other things going on, you’re going to need really good prediction. Metrics for this topic should focus not only on motion measurement accuracy and position accuracy, but also on the ability to successfully predict what happens next, even if a particular object performs a sudden change in direction, speed, and so on. In the end, your metric should help you understand the likelihood that you’ll correctly interpret where the free space is going to be so that your path planner can plan a safe path.